Engineer your edge.
Advanced PUBG MOBILE analytics, personalized performance insights, and professional tactical planning tools — built for players, coaches, and competitive teams.
- PLAYER 118.39
- #2PLAYER 217.66
- #3PLAYER 315.43
- #4PLAYER 414.16
Example built from anonymized, aggregated statistics
Official film · 75 seconds
PUBGM Stats. In action.
MP4 · 1080p · 25 MB · No music or voiceover
Share the film
Three steps
Record
Enter stats manually or import a screenshot into an open session.
Analyze
Review individual stats, team performance, MVP rankings and analytics.
Improve
Use insights to set priorities for the next practice session.
Plan every rotation before the match.
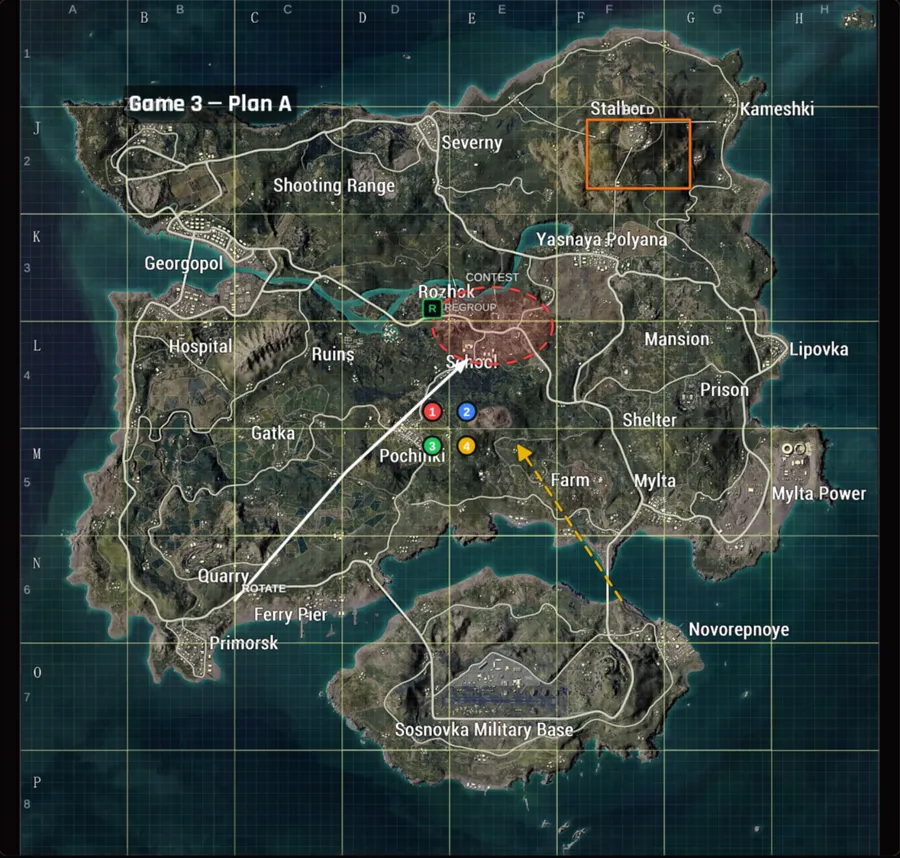
A professional tactical map editor built into PUBGM Stats. Screens below are taken from the real editor, with a demo team.
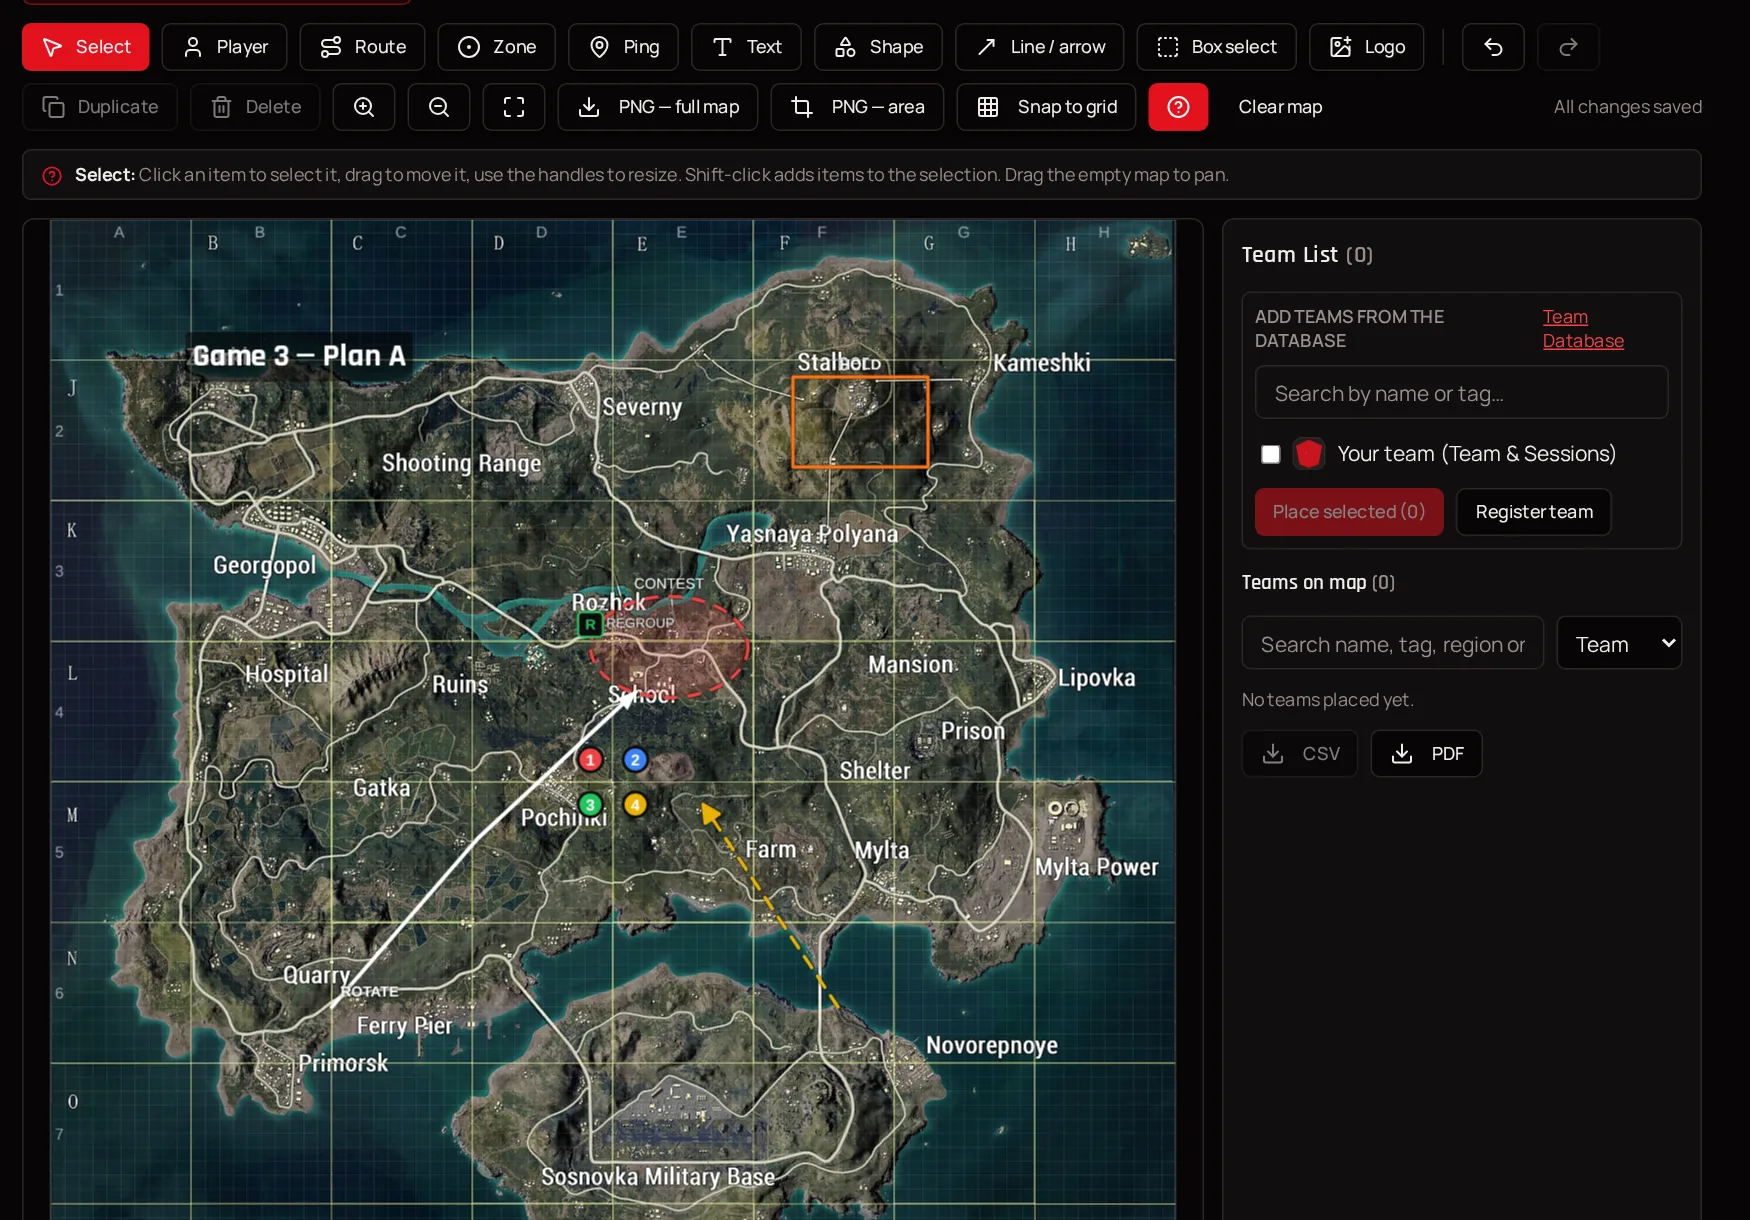
Real editor screenshot — demo team, made-up players.
- Erangel, Miramar and Rondo maps
- Team logos, player markers, pings and tactical zones
- Shapes, arrows, curved routes and text annotations
- Detailed plans for every match and scenario
- Teams selected from the shared Team Database
- Team placements and a list of the teams on each map
- Save, reopen and export high-resolution PNG maps
Included with Lifetime Pro and for Coach Partners.
Every match tells a story.
Kills, assists, damage and survival time for every player, with per-match averages and side-by-side comparisons — so a coach sees more than the final placement.
| Player | Kills | Assists | Damage | Survival | MVP |
|---|---|---|---|---|---|
| PLAYER 1 | 1.88 | 1.13 | 356 | 20.5 min | 18.39 |
| PLAYER 2 | 1.88 | 0.88 | 298 | 21.2 min | 17.66 |
| PLAYER 3 | 1.38 | 0.75 | 286 | 18.3 min | 15.43 |
| PLAYER 4 | 0.88 | 1 | 162 | 20.1 min | 14.16 |
Example built from anonymized, aggregated statistics
Understand who makes the difference.
When a session is closed, every recorded match feeds a summary: average kills, damage, survival and assists, and an MVP score ranking.
A proprietary score that combines kills, damage, assists and survival into a single number, calculated securely on our servers when a session is closed.
The MVP score summarizes recorded statistics. It supports constructive discussion — it is not a verdict on a player's overall value.
Example built from anonymized, aggregated statistics
Track progress. Identify patterns.
Follow damage match after match, compare players and spot inconsistent results. The charts update from your saved matches.
Consistency: Team damage ranged from 435 to 1962 across 8 matches — a signal worth reviewing.
Example built from anonymized, aggregated statistics
Turn statistics into training priorities.
The platform analyzes the statistics you record, compares each player to the team and to their own history, and suggests where to focus next.
- 1Statistics are recorded
- 2The data is analyzed
- 3Strengths and gaps are identified
- 4Training priorities are suggested
- PLAYER 1 delivered 32% of the team's damage.
- PLAYER 1 has the top MVP score (18.39).
- PLAYER 4: average damage 41% below the team average.
- PLAYER 3: assists 20% below the team average.
- PLAYER 4 — work on damage output.
- PLAYER 3 — work on team support (assists).
Insights only describe what the numbers show — they never guess causes. They support the coach's judgment; they don't replace it.
“Statistics are not here to judge players. They are here to understand performance, identify areas for improvement, and help teams progress.”
Example built from anonymized, aggregated statistics
From screenshot to actionable data.
Import PUBG Mobile end-of-match screenshots directly into an open training session.
Import a screenshot
Kills, assists, damage and survival are read automatically (AI-assisted)
Review and correct every value
Save the match into the current session
Session overview and analytics update
Unreadable values stay empty instead of being guessed, and nothing is saved until you confirm.
Aurelien MILESI
Designed for competitive performance.
“PUBGM Stats was built from my experience on the competitive PUBG MOBILE scene, with a clear objective: turn match data into actionable insights and give players and coaches better tools to prepare, analyze, and improve.”View Liquipedia profile
Who is it for?
Amateur teams
Structure your training with real numbers.
Semi-pro teams
Track performance consistently across sessions.
Coaches
Prioritize training more objectively.
Competitive players
Understand your own performance.
PUBGM Stats helps turn recorded data into a structured approach to improvement. It doesn't guarantee wins or rankings.
One payment. Lifetime access.
Create your account for free, then unlock every feature with a single payment — no subscription.
Free account
Create your account, set up your profile and language, and see the offer.
Create a free accountLifetime Pro
- Team, roster and session management
- Match statistics and player comparisons
- Daily MVP rankings
- Performance analytics and charts
- Coaching insights and training priorities
- Screenshot import with AI-assisted extraction
Frequently asked questions
Your next level starts with better analysis.
Record. Analyze. Adapt. Help your team improve one match at a time.